Climate quality is assessed on the basis of how it influences water availability to the plants. Consideration has been given to the amount of rainfall, air temperature and aridity. Climate layers and relative scores are reported in Table 3. In particular the selected layers are: Annual precipitation (a crucial parameter in plant growth); Bagnouls-Gaussen aridity index (a synthesis of precipitation, evapotranspiration and run-off information); Slope aspect (affects microclimatic conditions and erosion).
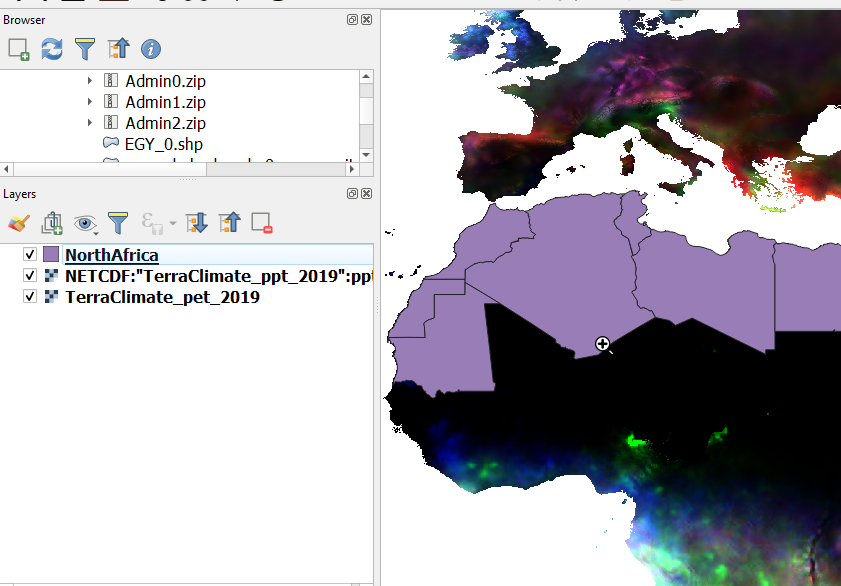
Open the downloaded Potential Evapotranspiration and Precipitation Datasets on Qgis.
Note
The two datasets are in NetCDF (Network Common Data Form) - a file format for storing multidimensional scientific data (variables) such as temperature, humidity, pressure, wind speed, and direction. Each of these variables can be displayed through a dimension (such as time) by making a layer or table view from the netCDF file.
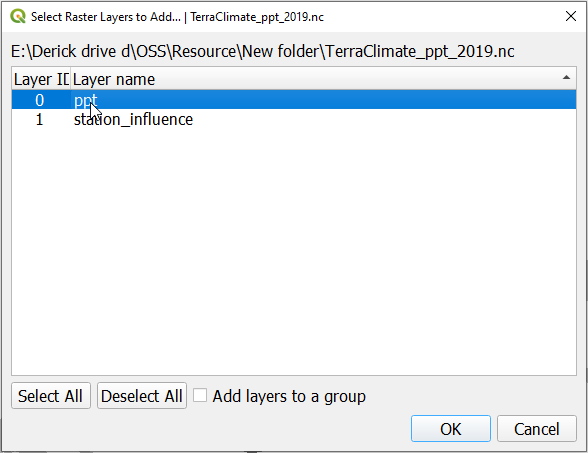
When loading the precipitation data select the ppt option on the Select Raster Layers to Add dialog that pops up.
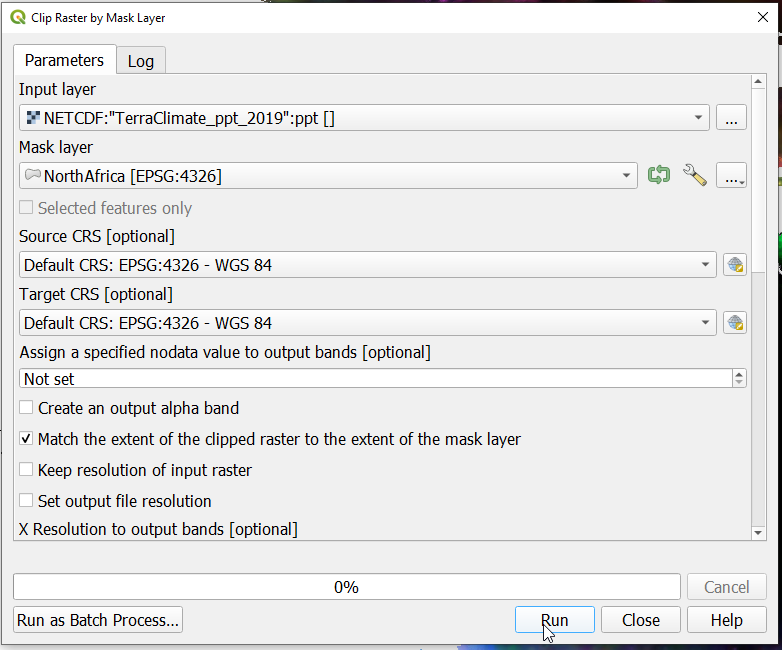
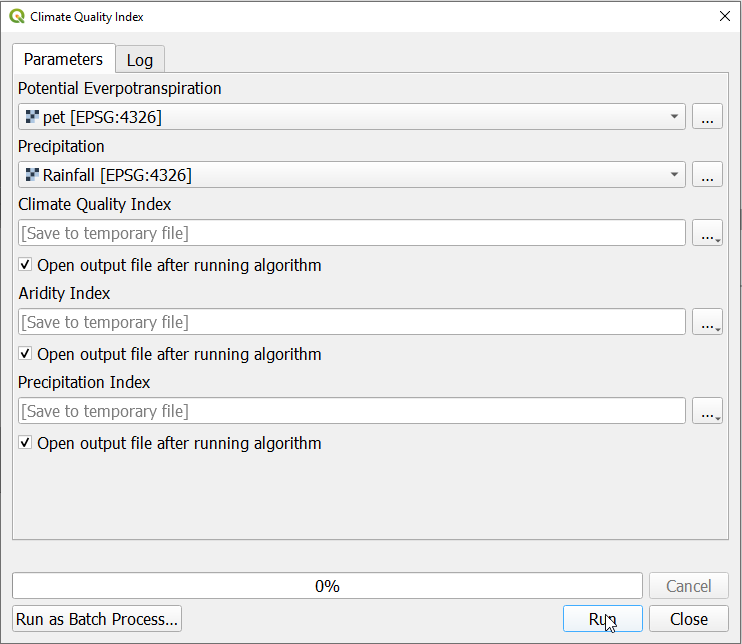
On the dialoge that pops up select the inputs as shown and specify the Source CRS and target CRS options as shown below. Save the outputs to your desired location before running the tool.
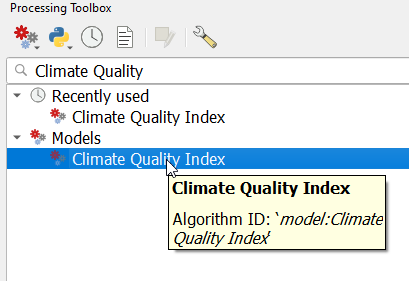
Once the layers are successfully cliped and saved, open the Processing toolbox and type “Climate Quality Index” and select the Climate Quality Index moded under Models
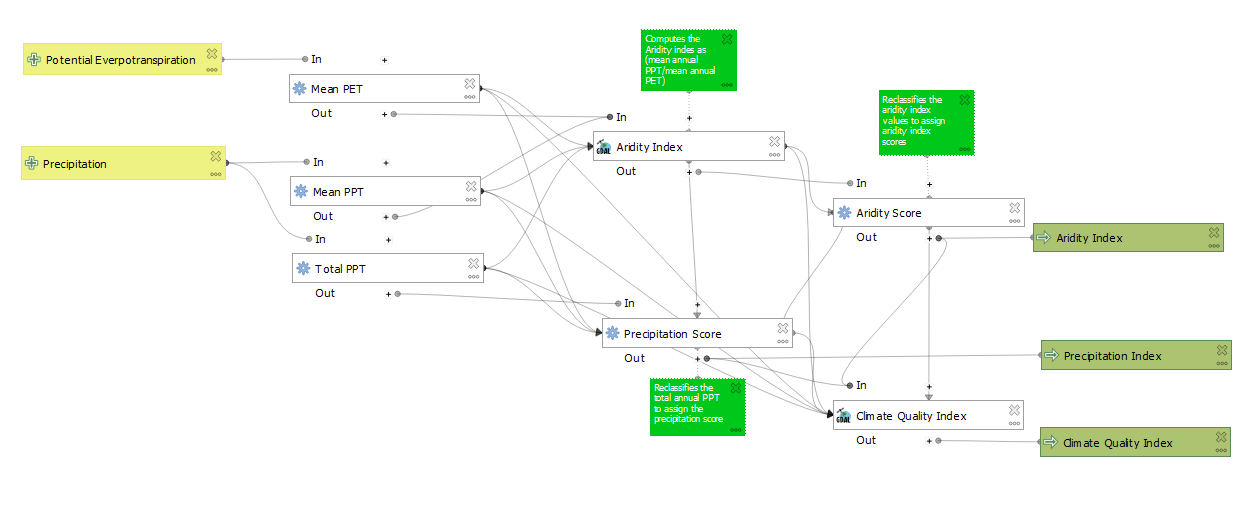
The CQI Model yeilds the Precipitation Index by computing the total annual precipitation and reclassifying the values. The Aridity Index is computed as the ration of the Mean annual precipitation and the potential evapotranspiration using the simple Penman-Monteith formulae. The process is as summarized in the graphical representation of the model shown below.
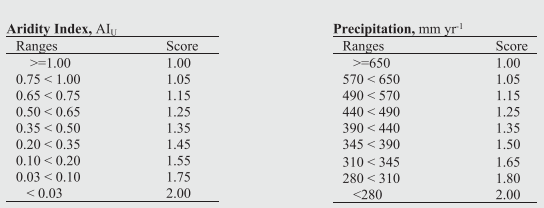
The classes for the precipitation and aridity index are obtained from: Ferrara, A*., Kosmas, C., Salvati, L., Padula, A., Mancino, G., & Nolè, A. (2020). Updating the MEDALUS‐ESA Framework for Worldwide Land Degradation and Desertification Assessment. Land Degradation & Development, 31(12), 1593-1607.
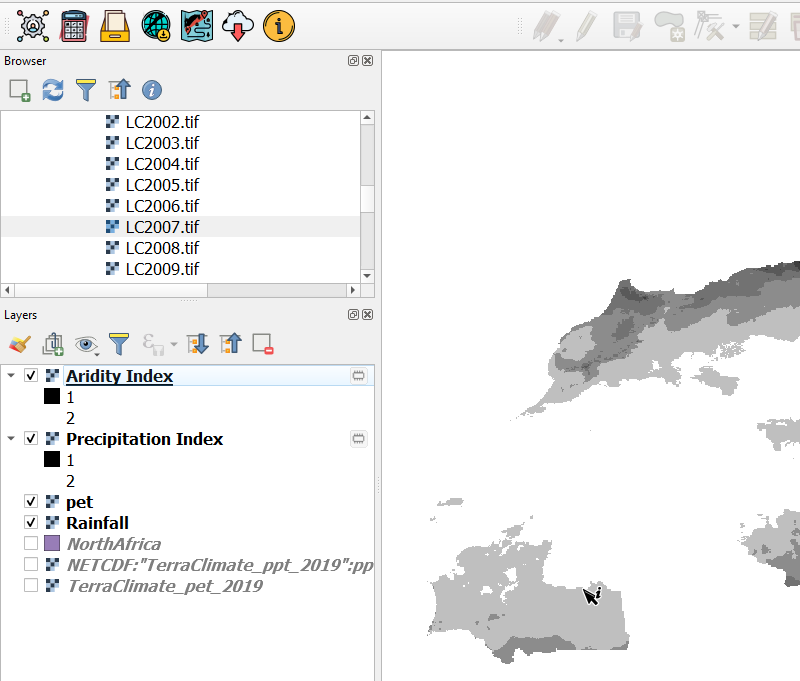
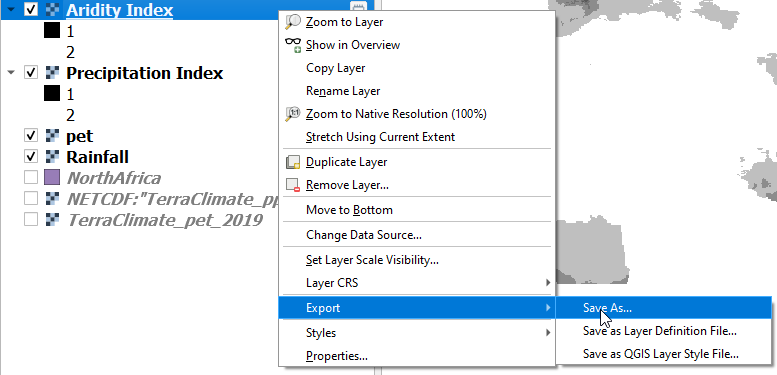
Once the model has been executed successfully, The ouputs will be loaded onto Qgis. Right click on the temporary layer and navigate to the Save as option to to export the layers with the desired Name, CRS and dimensions as shown below;
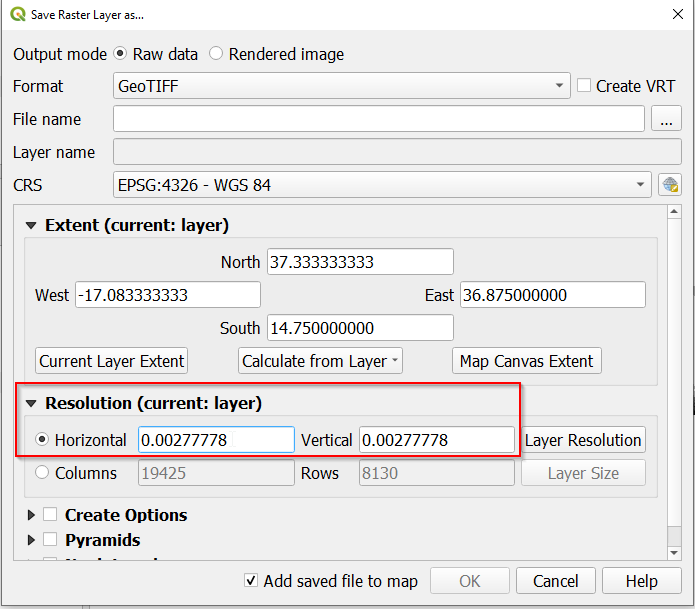
On the horizontal and vertical resolution setings in the Save as dialog paset the value 0.0027778 for each of the outpus to give the layers a resolution 0f 300m to match other variables for computing the desertification indicators
Setting the resolution of the output layers layers#